Object Based Classification
Object Based Classification
The data collected by UAS goes well beyond a pretty picture of what your house looks like from above. When gathered correctly, with the right type of sensor for the right job, your UAS data can be the most elite in the industry. It is what the operator and analyst know in terms of limits and potential that matters. For this post, we are going to be working with an online tutorial that walks you through classifying an aerial image to determine surface types. Our tutorial is going to be from The ArcGIS Lesson Gallery. Once there, search for the Calculate Impervious Surfaces from Spectral Imagery Tutorial.
The first step is to access your data and open it in ArcPro. To begin our classification, we will first want to extract the spectral bands.
Extract spectral bands: Multiband imagery uses natural color band combinations in a way the human eye would see it. We will create a new image by extracting the three bands that we want to show from the original image
- Select the layer you want in contents pane, in this case: Louisville_Neighborhood.tif
- Click imagery tab and then Raster Functions
- In raster function, search for Extract Bands
- For parameters
- Raster: Louisville_Neighborhood
- Method: BandIDs
- Combination: 4 1 3
- Missing Band Action: BestMatch
- Go to General and rename (... Extracted Bands)
- Click Create new layer


- Next uncheck the Parcels that cover up the imagery
The new Louisville Neighborhood Extracted Bands layer shows the imagery with the band combination we selected (4 1 3). The vegetation appears red, roads as grey, and roofs as gray or blue. This allows us to easily see the changes between natural and human made surfaces.
Configure The Classification Wizard: The classification wizard walks through the steps for image segmentation and classification
- Select Louisville Neighborhood Extracted Bands in the contents pane
- Click Imagery tab and select Classification Wizard
- Confirm that Classification Method is set to Supervised and Classification Type is set to Object Based. For Classification Schema select Use Default Schema
- Click Next
Segment The Image: The segmentation groups adjacent pixels with similar spectral characteristics into segments. This will make it easier to classify.
- For Spectral Detail, set to 8
- For Spatial Detail, set to 2
- For Minimum Segment Size in Pixel, confirm 20
- Confirm Show segment Boundaries Only is Not Checked
- Click Next

Classify The Image: A supervised classification is based on user defined training samples which indicate what type of pixels should be classified in what way.
In the Image Classification Wizard pane, right click each of the default classes and click remove class for each
- Right click NLCD2011 and select Add New Class
- Name: Impervious
- Value: 20
- Color: Gray 30%
- Click Okay
- Right click NLCD2011 and select Add New Class
- Name: Pervious
- Value: 40
- Color: Quetzal Green
- Click Okay
- Right click NLCD2011 and select Add New Class
- Name: Gray Roofs
- Value: 21
- Color: Gray 50%
- Click Okay
- Next click the Gray Roofs class to select it, then the Polygon Button (second from left).
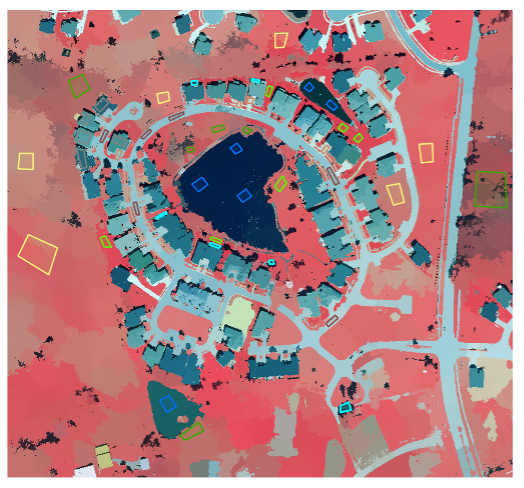
- Zoom to cul-de-sac in the northwest part of the neighborhood
- Draw a polygon on the roof, double click to finish the drawing. Make sure the polygon only covers pixels that make up the roof. You don’t need to select the whole roof, it just needs to be a sample.
- Repeat previous step for a few more houses to get a better sample
- Select all samples and click the Collapse button
- Right click Impervious and Add New Class and create two new subclasses:
- Name: Roads
- Value: 22
- Color: Cordovan Brown
- Name: Driveway
- Value: 23
- Color: Nubuck Tan
- Right Click Pervious and Add New Class for five subclasses based from the table below:
Subclass
Value
Color
Bare Earth
41
Medium Yellow
Grass
42
Medium Apple
Trees
43
Leaf Green
Water
44
Cretan Blue
Shadows
45
Sahara Sand
- Repeat step 5-7 for each subclass. Draw about 6 samples for each land-use type throughout the image.
- Click save button in Training Samples Manager and click Next.
Classify The Image: Now that we have created training samples, we will select the classification method. Each method uses different statistical process involving the training samples.
- In the Image Classification Wizard pane, confirm that Classifier is set to Support Vector Machine
- For Maximum Number of Samples Per Case, set to 0
- Click Run

- Once you are satisfied with the classification preview, click Next
- The next page is the Classify Page, we will use this page to run the actual classification and save it in the geodatabase
- For the Output Classification Dataset, change the name to: Classified_Louisville.tif and leave the rest of the parameters the same
- Click Run
The next page is the Merge Classes page, we will use this page to merge the subclasses into their parent classes. While the classes are important for an accurate classification, we are only interested in whether it’s pervious or impervious.
- For each new class, in the New Class column, select either Pervious or Impervious
- Click Run

Reclassify Errors: The last page of the wizard is the reclassifier page, this includes tools for correcting small errors in the raster dataset.
- In the Contents pane, uncheck every layer except the Preview_Reclass and Louisville_Neighborhood.tif
- Click Appearance tab and select the Swipe tool
- Drag your pointer across the screen to compare the preview to the original
- Once you locate any errors, within the wizard select Reclassify Within A Region
- This tool allows you to draw polygons on the map to reclassify
- In the Remap Classes section, confirm that:
- Current Class: Any
- New Class: Pervious
- Draw a polygon around the incorrect areas, the patches will automatically reclassify as a pervious surface
- Zoom to the full extent of the data
- In the Image Classification Wizard, for Final Classified Dataset, type Louisville_Impervious.tif
- Click Run
- Click Finish

Comments
Post a Comment